Table of Contents
The IPL points table is the first thing fans check every morning during cricket season. It tells you who’s dominating, who’s fighting for survival, and who’s already packing their bags.
This is the complete guide to the IPL points table — every season from 2008 to 2026, all the records, the trends, and the stories behind the numbers.
What is the IPL Points Table?
The IPL points table ranks all 10 teams based on their performance across the league stage. Every win, every no-result, every washout — it all shows up here.
Teams earn points throughout the 70-match league stage. The top 4 at the end qualify for the playoffs.
How teams earn points in IPL
Simple system:
- Win = 2 points
- No Result (rain, abandoned) = 1 point each
- Loss = 0 points
Importance of Net Run Rate (NRR)
When 2 or more teams finish level on points, NRR decides the ranking.
The formula: (Total runs scored ÷ Total overs faced) − (Total runs conceded ÷ Total overs bowled)
A positive NRR means you’re outscoring opponents on average. A negative one means the reverse. In tight playoff races, a single big win or a narrow defeat can shift NRR enough to change a team’s fate.
How the points table decides playoff qualification
The top 4 teams on the IPL points table at the end of the league stage qualify for the playoffs. The #1 and #2 teams get two chances to reach the final. The #3 and #4 teams get one chance each.
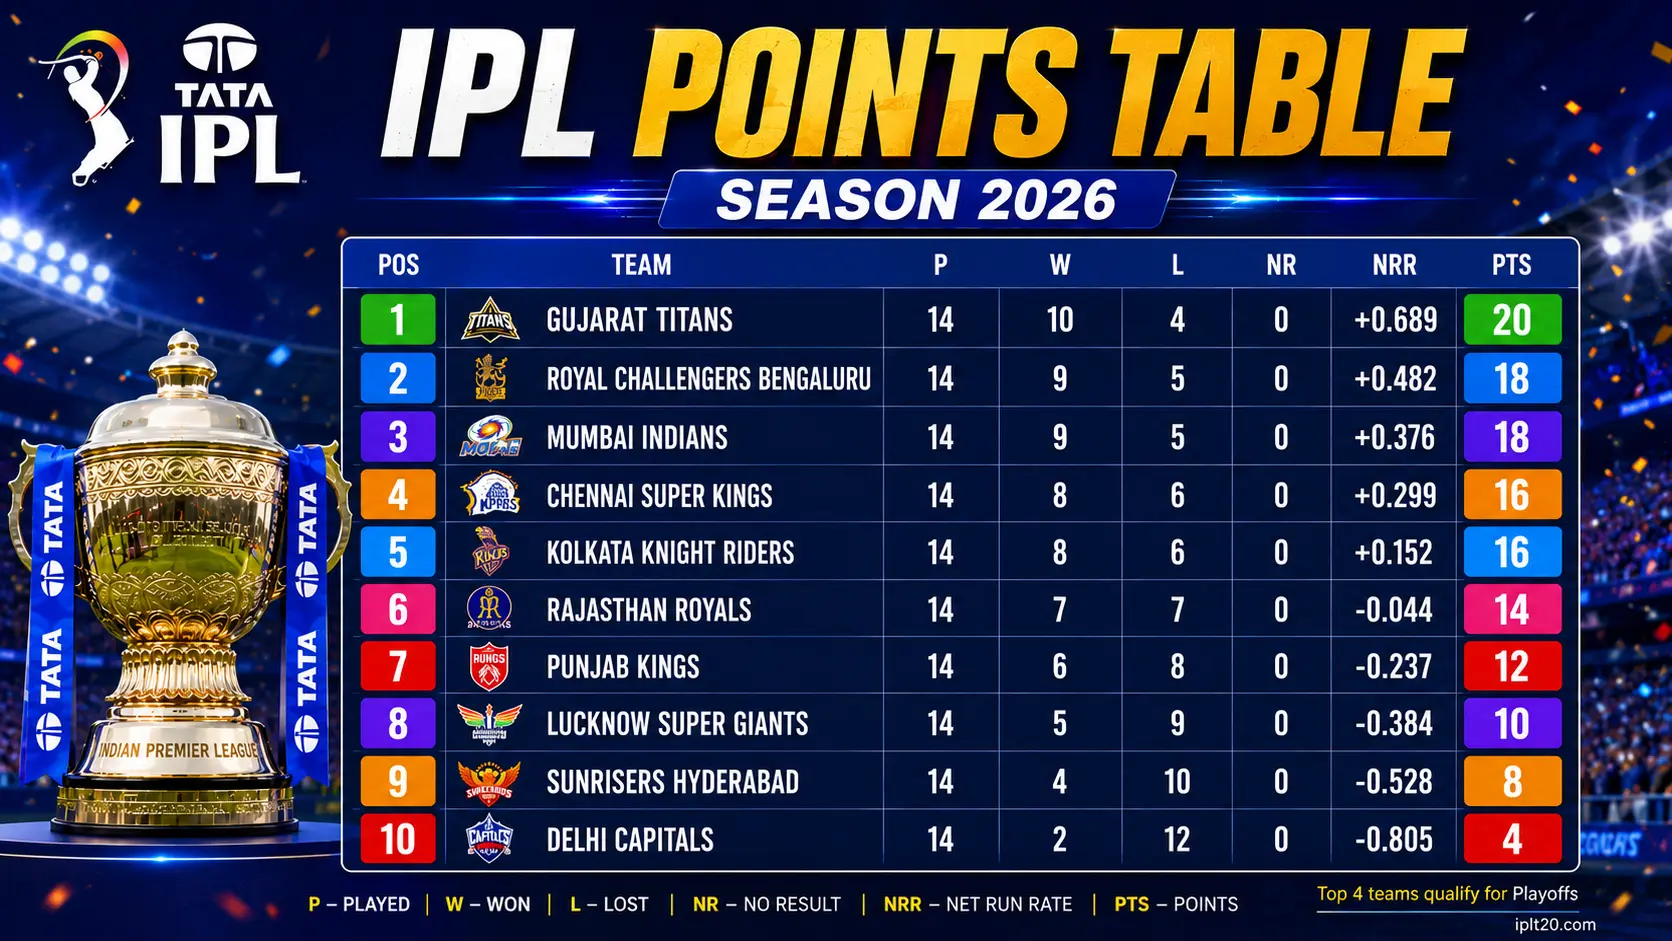
IPL 2026 Points Table (Final Standings)
RCB topped the 2026 IPL points table with 18 points and an NRR of +0.783. Gujarat Titans, SRH, and Rajasthan Royals joined them in the playoffs. MI and LSG both finished on just 8 points — a dismal end to the league stage for both.
RCB went on to win the title, defeating Gujarat Titans by 5 wickets in the final at Ahmedabad.
| Pos | Team | M | W | L | N/R | Pts | NRR |
|---|---|---|---|---|---|---|---|
| 1 | Royal Challengers Bengaluru ✅ | 14 | 9 | 5 | 0 | 18 | +0.783 |
| 2 | Gujarat Titans ✅ | 14 | 9 | 5 | 0 | 18 | +0.695 |
| 3 | Sunrisers Hyderabad ✅ | 14 | 9 | 5 | 0 | 18 | +0.524 |
| 4 | Rajasthan Royals ✅ | 14 | 8 | 6 | 0 | 16 | +0.189 |
| 5 | Punjab Kings | 14 | 7 | 6 | 1 | 15 | +0.309 |
| 6 | Delhi Capitals | 14 | 7 | 7 | 0 | 14 | -0.651 |
| 7 | Kolkata Knight Riders | 14 | 6 | 7 | 1 | 13 | -0.147 |
| 8 | Chennai Super Kings | 14 | 6 | 8 | 0 | 12 | -0.345 |
| 9 | Mumbai Indians | 14 | 4 | 10 | 0 | 8 | -0.584 |
| 10 | Lucknow Super Giants | 14 | 4 | 10 | 0 | 8 | -0.740 |
Champion: Royal Challengers Bengaluru | Runner-up: Gujarat Titans
IPL Points System Explained
Points award structure
| Result | Points |
|---|---|
| Win | 2 |
| No Result | 1 |
| Loss | 0 |
A team playing 14 league matches can earn a maximum of 28 points. In practice, 16+ points is usually enough to make the top 4. Below 12, you’re probably watching the playoffs from home.
What is Net Run Rate (NRR)?
NRR is the difference between your average runs per over scored and your average runs per over conceded — across all matches in the tournament.
Formula:
NRR = (Total runs scored ÷ Total overs faced) − (Total runs conceded ÷ Total overs bowled)
Why it matters so much: in 2019, all three teams at the top of the IPL points table finished on 18 points. NRR separated them into positions 1, 2, and 3. It’s also what knocked RCB out in 2019 despite winning 5 games — their NRR was just worse than teams above them.
IPL playoff qualification rules
Top 4 teams qualify. If 2 teams have the same points, NRR decides. If NRR is also equal (extremely rare), head-to-head result settles it.
Positions 1 and 2 play Qualifier 1 — the winner goes straight to the final. Positions 3 and 4 play the Eliminator — the loser goes home. The Qualifier 1 loser gets another shot in Qualifier 2.
IPL Points Table Winners by Season (2008–2026)
Season-wise league stage table toppers
| Season | Table Topper | Points | Result |
|---|---|---|---|
| 2008 | Rajasthan Royals | 22 | Champions |
| 2009 | Delhi Daredevils | 20 | Semi-final exit |
| 2010 | Mumbai Indians | 20 | Final |
| 2011 | Royal Challengers Bangalore | 19 | Final |
| 2012 | Delhi Daredevils | 22 | Semi-final exit |
| 2013 | Chennai Super Kings | 22 | Final |
| 2014 | Punjab Kings | 22 | Final |
| 2015 | Chennai Super Kings | 18 | Champions |
| 2016 | Gujarat Lions | 18 | Playoffs exit |
| 2017 | Mumbai Indians | 20 | Champions |
| 2018 | Sunrisers Hyderabad | 18 | Final |
| 2019 | Mumbai Indians | 18 | Champions |
| 2020 | Mumbai Indians | 18 | Champions |
| 2021 | Delhi Capitals | 20 | Playoffs exit |
| 2022 | Gujarat Titans | 20 | Champions |
| 2023 | Gujarat Titans | 20 | Final |
| 2024 | Kolkata Knight Riders | 20 | Champions |
| 2025 | Punjab Kings | 19 | Final |
| 2026 | Royal Challengers Bengaluru | 18 | Champions |
How many times each team finished first
| Team | Times Finished #1 |
|---|---|
| Mumbai Indians | 4 (2010, 2017, 2019, 2020) |
| Chennai Super Kings | 2 (2013, 2015) |
| Delhi Capitals/Daredevils | 2 (2009, 2012, 2021) |
| Gujarat Titans | 2 (2022, 2023) |
| Rajasthan Royals | 1 (2008) |
| Royal Challengers Bengaluru | 1 (2011, 2026) |
| Sunrisers Hyderabad | 1 (2018) |
| Gujarat Lions | 1 (2016) |
| Punjab Kings | 1 (2014, 2025) |
| Kolkata Knight Riders | 1 (2024) |
IPL Points Table All Seasons (2008–2026)
IPL 2026 Points Table
Champion: Royal Challengers Bengaluru | Playoff teams: RCB, GT, SRH, RR
| Pos | Team | M | W | L | N/R | Pts | NRR |
|---|---|---|---|---|---|---|---|
| 1 | Royal Challengers Bengaluru ✅ | 14 | 9 | 5 | 0 | 18 | +0.783 |
| 2 | Gujarat Titans ✅ | 14 | 9 | 5 | 0 | 18 | +0.695 |
| 3 | Sunrisers Hyderabad ✅ | 14 | 9 | 5 | 0 | 18 | +0.524 |
| 4 | Rajasthan Royals ✅ | 14 | 8 | 6 | 0 | 16 | +0.189 |
| 5 | Punjab Kings | 14 | 7 | 6 | 1 | 15 | +0.309 |
| 6 | Delhi Capitals | 14 | 7 | 7 | 0 | 14 | -0.651 |
| 7 | Kolkata Knight Riders | 14 | 6 | 7 | 1 | 13 | -0.147 |
| 8 | Chennai Super Kings | 14 | 6 | 8 | 0 | 12 | -0.345 |
| 9 | Mumbai Indians | 14 | 4 | 10 | 0 | 8 | -0.584 |
| 10 | Lucknow Super Giants | 14 | 4 | 10 | 0 | 8 | -0.740 |
3 teams — RCB, GT, SRH — finished level on 18 points. NRR separated them. RCB went on to win back-to-back titles, joining MI and CSK as the only franchises to defend the IPL crown.
IPL 2025 Points Table
Champion: Royal Challengers Bengaluru | Playoff teams: PBKS, RCB, GT, MI
| Pos | Team | M | W | L | N/R | Pts | NRR |
|---|---|---|---|---|---|---|---|
| 1 | Punjab Kings ✅ | 14 | 9 | 4 | 1 | 19 | +0.372 |
| 2 | Royal Challengers Bengaluru ✅ | 14 | 9 | 4 | 1 | 19 | +0.301 |
| 3 | Gujarat Titans ✅ | 14 | 9 | 5 | 0 | 18 | +0.254 |
| 4 | Mumbai Indians ✅ | 14 | 8 | 6 | 0 | 16 | +1.142 |
| 5 | Delhi Capitals | 14 | 7 | 6 | 1 | 15 | +0.011 |
| 6 | Sunrisers Hyderabad | 14 | 6 | 7 | 1 | 13 | -0.241 |
| 7 | Lucknow Super Giants | 14 | 6 | 8 | 0 | 12 | -0.376 |
| 8 | Kolkata Knight Riders | 14 | 5 | 7 | 2 | 12 | -0.305 |
| 9 | Rajasthan Royals | 14 | 4 | 10 | 0 | 8 | -0.549 |
| 10 | Chennai Super Kings | 14 | 4 | 10 | 0 | 8 | -0.647 |
PBKS topped the IPL points table for the first time ever — and still lost the final. RCB won their maiden title by 6 runs, one of the closest finals in IPL history. CSK’s 10-loss campaign was their worst ever.
IPL 2024 Points Table
Champion: Kolkata Knight Riders | Playoff teams: KKR, SRH, RR, RCB
| Pos | Team | M | W | L | N/R | Pts | NRR |
|---|---|---|---|---|---|---|---|
| 1 | Kolkata Knight Riders ✅ | 14 | 9 | 3 | 2 | 20 | +1.428 |
| 2 | Sunrisers Hyderabad ✅ | 14 | 8 | 5 | 1 | 17 | +0.414 |
| 3 | Rajasthan Royals ✅ | 14 | 8 | 5 | 1 | 17 | +0.273 |
| 4 | Royal Challengers Bengaluru ✅ | 14 | 7 | 7 | 0 | 14 | +0.459 |
| 5 | Chennai Super Kings | 14 | 7 | 7 | 0 | 14 | +0.392 |
| 6 | Delhi Capitals | 14 | 7 | 7 | 0 | 14 | -0.377 |
| 7 | Lucknow Super Giants | 14 | 7 | 7 | 0 | 14 | -0.667 |
| 8 | Gujarat Titans | 14 | 5 | 7 | 2 | 12 | -1.063 |
| 9 | Punjab Kings | 14 | 5 | 9 | 0 | 10 | -0.353 |
| 10 | Mumbai Indians | 14 | 4 | 10 | 0 | 8 | -0.318 |
KKR’s 2024 run was historically dominant — a +1.428 NRR and 20 points, the best combined league-stage performance in recent IPL history. MI finished bottom. SRH’s batting fireworks (they set the all-time IPL record of 287 runs in an innings) made them the most watchable team despite losing the final.
IPL 2023 Points Table
Champion: Chennai Super Kings | Playoff teams: GT, CSK, LSG, MI
| Pos | Team | M | W | L | N/R | Pts | NRR |
|---|---|---|---|---|---|---|---|
| 1 | Gujarat Titans ✅ | 14 | 10 | 4 | 0 | 20 | +0.809 |
| 2 | Chennai Super Kings ✅ | 14 | 8 | 5 | 1 | 17 | +0.652 |
| 3 | Lucknow Super Giants ✅ | 14 | 8 | 5 | 1 | 17 | +0.284 |
| 4 | Mumbai Indians ✅ | 14 | 8 | 6 | 0 | 16 | -0.044 |
| 5 | Rajasthan Royals | 14 | 7 | 7 | 0 | 14 | +0.148 |
| 6 | Royal Challengers Bengaluru | 14 | 7 | 7 | 0 | 14 | +0.135 |
| 7 | Kolkata Knight Riders | 14 | 6 | 8 | 0 | 12 | -0.239 |
| 8 | Punjab Kings | 14 | 6 | 8 | 0 | 12 | -0.304 |
| 9 | Delhi Capitals | 14 | 5 | 9 | 0 | 10 | -0.808 |
| 10 | Sunrisers Hyderabad | 14 | 4 | 10 | 0 | 8 | -0.590 |
GT topped the IPL points table for the second year running. CSK won their 5th title from the 2nd position — proving yet again that the table topper doesn’t always go home with the trophy.
IPL 2022 Points Table
Champion: Gujarat Titans | Playoff teams: GT, RR, LSG, RCB
| Pos | Team | M | W | L | N/R | Pts | NRR |
|---|---|---|---|---|---|---|---|
| 1 | Gujarat Titans ✅ | 14 | 10 | 4 | 0 | 20 | +0.316 |
| 2 | Rajasthan Royals ✅ | 14 | 9 | 5 | 0 | 18 | +0.298 |
| 3 | Lucknow Super Giants ✅ | 14 | 9 | 5 | 0 | 18 | +0.251 |
| 4 | Royal Challengers Bengaluru ✅ | 14 | 8 | 6 | 0 | 16 | -0.253 |
| 5 | Delhi Capitals | 14 | 7 | 7 | 0 | 14 | +0.204 |
| 6 | Punjab Kings | 14 | 7 | 7 | 0 | 14 | +0.126 |
| 7 | Kolkata Knight Riders | 14 | 6 | 8 | 0 | 12 | +0.146 |
| 8 | Sunrisers Hyderabad | 14 | 6 | 8 | 0 | 12 | -0.379 |
| 9 | Chennai Super Kings | 14 | 4 | 10 | 0 | 8 | -0.203 |
| 10 | Mumbai Indians | 14 | 4 | 10 | 0 | 8 | -0.506 |
The 10-team format debuted. Gujarat Titans, a brand-new franchise in their very first IPL season, topped the IPL points table and won the title. Extraordinary. CSK and MI — 10 combined titles between them — both finished last. One of the great upsets in IPL history.
IPL 2021 Points Table
Champion: Chennai Super Kings | Playoff teams: DC, CSK, RCB, KKR
| Pos | Team | M | W | L | N/R | Pts | NRR |
|---|---|---|---|---|---|---|---|
| 1 | Delhi Capitals ✅ | 14 | 10 | 4 | 0 | 20 | +0.481 |
| 2 | Chennai Super Kings ✅ | 14 | 9 | 5 | 0 | 18 | +0.455 |
| 3 | Royal Challengers Bengaluru ✅ | 14 | 9 | 5 | 0 | 18 | +0.173 |
| 4 | Kolkata Knight Riders ✅ | 14 | 7 | 7 | 0 | 14 | +0.587 |
| 5 | Mumbai Indians | 14 | 7 | 7 | 0 | 14 | -0.074 |
| 6 | Punjab Kings | 14 | 6 | 8 | 0 | 12 | -0.346 |
| 7 | Rajasthan Royals | 14 | 5 | 9 | 0 | 10 | -0.990 |
| 8 | Sunrisers Hyderabad | 14 | 3 | 11 | 0 | 6 | -0.545 |
DC topped the table — their personal best in IPL history. CSK won the title from 2nd position. SRH’s 3-win season was one of the worst single-franchise campaigns ever. The season was split across India and UAE due to COVID-19.
IPL 2020 Points Table
Champion: Mumbai Indians | Playoff teams: MI, DC, SRH, RCB
| Pos | Team | M | W | L | N/R | Pts | NRR |
|---|---|---|---|---|---|---|---|
| 1 | Mumbai Indians ✅ | 14 | 9 | 5 | 0 | 18 | +1.107 |
| 2 | Delhi Capitals ✅ | 14 | 8 | 6 | 0 | 16 | +0.481 |
| 3 | Sunrisers Hyderabad ✅ | 14 | 7 | 7 | 0 | 14 | +0.606 |
| 4 | Royal Challengers Bengaluru ✅ | 14 | 7 | 7 | 0 | 14 | -0.109 |
| 5 | Kolkata Knight Riders | 14 | 7 | 7 | 0 | 14 | -0.002 |
| 6 | Punjab Kings | 14 | 6 | 8 | 0 | 12 | -0.149 |
| 7 | Chennai Super Kings | 14 | 6 | 8 | 0 | 12 | -0.455 |
| 8 | Rajasthan Royals | 14 | 6 | 8 | 0 | 12 | -1.462 |
Played entirely in the UAE. MI won their 5th title — back-to-back championships. The entire season was the tightest ever, with all 8 teams finishing within 6 points of each other. CSK had their worst-ever campaign to that point.
IPL 2019 Points Table
Champion: Mumbai Indians | Playoff teams: MI, CSK, DC, SRH
| Pos | Team | M | W | L | N/R | Pts | NRR |
|---|---|---|---|---|---|---|---|
| 1 | Mumbai Indians ✅ | 14 | 9 | 5 | 0 | 18 | +0.421 |
| 2 | Chennai Super Kings ✅ | 14 | 9 | 5 | 0 | 18 | +0.131 |
| 3 | Delhi Capitals ✅ | 14 | 9 | 5 | 0 | 18 | +0.044 |
| 4 | Sunrisers Hyderabad ✅ | 14 | 6 | 8 | 0 | 12 | +0.577 |
| 5 | Kolkata Knight Riders | 14 | 6 | 8 | 0 | 12 | -0.070 |
| 6 | Punjab Kings | 14 | 6 | 8 | 0 | 12 | -0.251 |
| 7 | Rajasthan Royals | 14 | 5 | 8 | 1 | 11 | -0.570 |
| 8 | Royal Challengers Bengaluru | 14 | 5 | 8 | 1 | 11 | -0.890 |
3 teams tied on 18 points at the top. NRR split them into positions 1, 2, and 3. MI won the title by 1 run in the final against CSK — one of the greatest IPL finals ever played.
IPL 2018 Points Table
Champion: Chennai Super Kings | Playoff teams: SRH, CSK, KKR, RR
| Pos | Team | M | W | L | N/R | Pts | NRR |
|---|---|---|---|---|---|---|---|
| 1 | Sunrisers Hyderabad ✅ | 14 | 9 | 5 | 0 | 18 | +0.284 |
| 2 | Chennai Super Kings ✅ | 14 | 9 | 5 | 0 | 18 | +0.253 |
| 3 | Kolkata Knight Riders ✅ | 14 | 8 | 6 | 0 | 16 | -0.070 |
| 4 | Rajasthan Royals ✅ | 14 | 7 | 7 | 0 | 14 | -0.250 |
| 5 | Mumbai Indians | 14 | 6 | 8 | 0 | 12 | +0.317 |
| 6 | Royal Challengers Bengaluru | 14 | 6 | 8 | 0 | 12 | +0.129 |
| 7 | Punjab Kings | 14 | 6 | 8 | 0 | 12 | -0.502 |
| 8 | Delhi Capitals | 14 | 5 | 9 | 0 | 10 | -0.222 |
CSK’s comeback season. After serving a two-year suspension, they returned and won the title immediately. SRH topped the IPL points table but lost the final to their opponents from Chennai.
IPL 2017 Points Table
Champion: Mumbai Indians | Playoff teams: MI, RPS, SRH, KKR
| Pos | Team | M | W | L | N/R | Pts | NRR |
|---|---|---|---|---|---|---|---|
| 1 | Mumbai Indians ✅ | 14 | 10 | 4 | 0 | 20 | +0.784 |
| 2 | Rising Pune Supergiant ✅ | 14 | 9 | 5 | 0 | 18 | +0.376 |
| 3 | Sunrisers Hyderabad ✅ | 14 | 8 | 6 | 0 | 16 | +0.593 |
| 4 | Kolkata Knight Riders ✅ | 14 | 8 | 6 | 0 | 16 | +0.641 |
| 5 | Delhi Daredevils | 14 | 6 | 8 | 0 | 12 | +0.037 |
| 6 | Gujarat Lions | 14 | 5 | 9 | 0 | 10 | -0.752 |
| 7 | Punjab Kings | 14 | 5 | 9 | 0 | 10 | -0.390 |
| 8 | Royal Challengers Bengaluru | 14 | 3 | 11 | 0 | 7 | -1.299 |
MI dominated from wire to wire. They topped the IPL points table and won the title by 1 run in one of the closest finals ever. RCB’s 2017 season — 3 wins and 7 points — was one of the worst campaigns by a marquee franchise in IPL history, especially given they had Virat Kohli and AB de Villiers.
IPL 2016 Points Table
Champion: Sunrisers Hyderabad | Playoff teams: GL, RCB, SRH, KKR
| Pos | Team | M | W | L | N/R | Pts | NRR |
|---|---|---|---|---|---|---|---|
| 1 | Gujarat Lions ✅ | 14 | 9 | 5 | 0 | 18 | -0.374 |
| 2 | Royal Challengers Bengaluru ✅ | 14 | 8 | 6 | 0 | 16 | +0.932 |
| 3 | Sunrisers Hyderabad ✅ | 14 | 8 | 6 | 0 | 16 | +0.245 |
| 4 | Kolkata Knight Riders ✅ | 14 | 8 | 6 | 0 | 16 | +0.106 |
| 5 | Mumbai Indians | 14 | 7 | 7 | 0 | 14 | -0.146 |
| 6 | Delhi Daredevils | 14 | 7 | 7 | 0 | 14 | -0.155 |
| 7 | Rising Pune Supergiants | 14 | 5 | 9 | 0 | 10 | +0.015 |
| 8 | Punjab Kings | 14 | 4 | 10 | 0 | 8 | -0.646 |
CSK and RR were suspended for 2 years; Gujarat Lions and Rising Pune Supergiants replaced them. SRH won their maiden IPL title despite finishing 3rd in the league stage. RCB had an NRR of +0.932 — the best in the tournament — but lost the final.
IPL 2015 Points Table
Champion: Mumbai Indians | Playoff teams: CSK, MI, RR, RCB
| Pos | Team | M | W | L | N/R | Pts | NRR |
|---|---|---|---|---|---|---|---|
| 1 | Chennai Super Kings ✅ | 14 | 9 | 5 | 0 | 18 | +0.634 |
| 2 | Mumbai Indians ✅ | 14 | 9 | 5 | 0 | 18 | +0.519 |
| 3 | Rajasthan Royals ✅ | 14 | 8 | 6 | 0 | 16 | +0.184 |
| 4 | Royal Challengers Bengaluru ✅ | 14 | 7 | 7 | 0 | 14 | +1.037 |
| 5 | Sunrisers Hyderabad | 14 | 6 | 8 | 0 | 12 | +0.025 |
| 6 | Kolkata Knight Riders | 14 | 6 | 8 | 0 | 12 | -0.145 |
| 7 | Punjab Kings | 14 | 3 | 11 | 0 | 6 | -1.436 |
| 8 | Delhi Daredevils | 14 | 5 | 9 | 0 | 10 | -0.730 |
CSK topped the IPL points table but MI won the final between the two of them. RCB’s +1.037 NRR showed their batting firepower but they lost in the playoffs. PBKS’s 3-win, 6-point season remains one of the worst in IPL history.
IPL 2014 Points Table
Champion: Kolkata Knight Riders | Playoff teams: PBKS, CSK, KKR, KXIP**
| Pos | Team | M | W | L | N/R | Pts | NRR |
|---|---|---|---|---|---|---|---|
| 1 | Punjab Kings ✅ | 14 | 11 | 3 | 0 | 22 | +0.968 |
| 2 | Chennai Super Kings ✅ | 14 | 9 | 5 | 0 | 18 | +0.540 |
| 3 | Kolkata Knight Riders ✅ | 14 | 8 | 6 | 0 | 16 | +0.186 |
| 4 | Mumbai Indians ✅ | 14 | 8 | 6 | 0 | 16 | +0.153 |
| 5 | Sunrisers Hyderabad | 14 | 7 | 7 | 0 | 14 | +0.037 |
| 6 | Rajasthan Royals | 14 | 7 | 7 | 0 | 14 | -0.228 |
| 7 | Royal Challengers Bengaluru | 14 | 6 | 8 | 0 | 12 | -0.212 |
| 8 | Sunrisers Hyderabad | — | — | — | — | — | — |
| 9 | Deccan Chargers** | — | — | — | — | — | — |
| 10 | Delhi Daredevils | 14 | 2 | 12 | 0 | 4 | -1.182 |
PBKS matched RR’s 2008 record with 22 points — and still lost the final to KKR. Delhi’s 4-point return equalled the all-time low set by Deccan Chargers in 2008. It was also the season KKR chased down PBKS’s total of 199 in the final to win their second title.
Also Read : IPL Schedule 2026
IPL 2013 Points Table
Champion: Mumbai Indians | Playoff teams: CSK, MI, RR, SRH
| Pos | Team | M | W | L | N/R | Pts | NRR |
|---|---|---|---|---|---|---|---|
| 1 | Chennai Super Kings ✅ | 16 | 11 | 5 | 0 | 22 | +0.624 |
| 2 | Mumbai Indians ✅ | 16 | 11 | 5 | 0 | 22 | +0.482 |
| 3 | Rajasthan Royals ✅ | 16 | 8 | 8 | 0 | 16 | -0.107 |
| 4 | Sunrisers Hyderabad ✅ | 16 | 8 | 8 | 0 | 16 | +0.123 |
| 5 | Royal Challengers Bengaluru | 16 | 8 | 7 | 1 | 17 | +0.219 |
| 6 | Kolkata Knight Riders | 16 | 7 | 9 | 0 | 14 | +0.083 |
| 7 | Kings XI Punjab | 16 | 6 | 10 | 0 | 12 | -0.167 |
| 8 | Pune Warriors India | 16 | 4 | 11 | 1 | 9 | -0.558 |
| 9 | Delhi Daredevils | 16 | 3 | 13 | 0 | 6 | -0.859 |
CSK and MI both hit 22 points — the joint-highest ever. Mumbai won the title, defeating CSK by 23 runs. Rohit Sharma’s first season as captain. Delhi’s 3-win, 6-point campaign was historically bad. This was also the last season for the Pune Warriors franchise.
IPL 2012 Points Table
Champion: Kolkata Knight Riders | Playoff teams: DD, KKR, MI, CSK
| Pos | Team | M | W | L | N/R | Pts | NRR |
|---|---|---|---|---|---|---|---|
| 1 | Delhi Daredevils ✅ | 16 | 11 | 5 | 0 | 22 | +0.617 |
| 2 | Kolkata Knight Riders ✅ | 16 | 10 | 5 | 1 | 21 | +0.561 |
| 3 | Mumbai Indians ✅ | 16 | 10 | 6 | 0 | 20 | -0.100 |
| 4 | Chennai Super Kings ✅ | 16 | 8 | 7 | 1 | 17 | +0.100 |
| 5 | Royal Challengers Bengaluru | 16 | 8 | 7 | 1 | 17 | -0.105 |
| 6 | Sunrisers Hyderabad | 16 | 7 | 8 | 1 | 15 | -0.155 |
| 7 | Rajasthan Royals | 16 | 7 | 9 | 0 | 14 | -0.079 |
| 8 | Punjab Kings | 16 | 5 | 10 | 1 | 11 | -0.286 |
| 9 | Deccan Chargers | 16 | 4 | 12 | 0 | 8 | -0.617 |
DD topped the IPL points table with 22 points but exited in the playoffs. KKR won their first-ever IPL title, chasing down CSK’s 190 in the final. This was the first 16-match format season.
IPL 2011 Points Table
Champion: Chennai Super Kings | Playoff teams: RCB, CSK, MI, KKR
| Pos | Team | M | W | L | N/R | Pts | NRR |
|---|---|---|---|---|---|---|---|
| 1 | Royal Challengers Bengaluru ✅ | 14 | 9 | 4 | 1 | 19 | +0.326 |
| 2 | Chennai Super Kings ✅ | 14 | 9 | 5 | 0 | 18 | +0.443 |
| 3 | Mumbai Indians ✅ | 14 | 9 | 5 | 0 | 18 | +0.040 |
| 4 | Kolkata Knight Riders ✅ | 14 | 8 | 6 | 0 | 16 | +0.433 |
| 5 | Punjab Kings | 14 | 7 | 7 | 0 | 14 | -0.051 |
| 6 | Rajasthan Royals | 14 | 6 | 7 | 1 | 13 | -0.691 |
| 7 | Deccan Chargers | 14 | 6 | 8 | 0 | 12 | +0.222 |
| 8 | Kochi Tuskers Kerala | 14 | 6 | 8 | 0 | 12 | -0.214 |
| 9 | Pune Warriors India | 14 | 4 | 9 | 1 | 9 | -0.134 |
| 10 | Delhi Daredevils | 14 | 4 | 9 | 1 | 9 | -0.448 |
First season with the modern playoff format. RCB topped the IPL points table, powered by Chris Gayle. CSK beat them by 58 runs in the final to win back-to-back titles — the first franchise to do so.
IPL 2010 Points Table
Champion: Chennai Super Kings | Playoff teams: MI, DC, CSK, RCB
| Pos | Team | M | W | L | N/R | Pts | NRR |
|---|---|---|---|---|---|---|---|
| 1 | Mumbai Indians ✅ | 14 | 10 | 4 | 0 | 20 | +1.084 |
| 2 | Deccan Chargers ✅ | 14 | 8 | 6 | 0 | 16 | -0.297 |
| 3 | Chennai Super Kings ✅ | 14 | 7 | 7 | 0 | 14 | +0.274 |
| 4 | Royal Challengers Bengaluru ✅ | 14 | 7 | 7 | 0 | 14 | +0.219 |
| 5 | Delhi Daredevils | 14 | 7 | 7 | 0 | 14 | +0.021 |
| 6 | Kolkata Knight Riders | 14 | 7 | 7 | 0 | 14 | -0.341 |
| 7 | Rajasthan Royals | 14 | 6 | 8 | 0 | 12 | -0.514 |
| 8 | Punjab Kings | 14 | 4 | 10 | 0 | 8 | -0.478 |
MI topped with 20 points but CSK — finishing 3rd — won the title by beating MI in the final. MS Dhoni’s first IPL trophy. Five teams tied on 14 points in the middle of the table.
IPL 2009 Points Table
Champion: Deccan Chargers | Playoff teams: DD, CSK, RCB, DC
| Pos | Team | M | W | L | N/R | Pts | NRR |
|---|---|---|---|---|---|---|---|
| 1 | Delhi Daredevils ✅ | 14 | 10 | 4 | 0 | 20 | +0.311 |
| 2 | Chennai Super Kings ✅ | 14 | 8 | 5 | 1 | 17 | +0.951 |
| 3 | Royal Challengers Bengaluru ✅ | 14 | 8 | 6 | 0 | 16 | -0.191 |
| 4 | Deccan Chargers ✅ | 14 | 7 | 7 | 0 | 14 | +0.203 |
| 5 | Punjab Kings | 14 | 7 | 7 | 0 | 14 | -0.483 |
| 6 | Rajasthan Royals | 14 | 6 | 7 | 1 | 13 | -0.352 |
| 7 | Mumbai Indians | 14 | 5 | 8 | 1 | 11 | +0.297 |
| 8 | Kolkata Knight Riders | 14 | 3 | 10 | 1 | 7 | -0.789 |
Hosted in South Africa due to India’s general elections. Deccan Chargers — dead last in 2008 with 4 points — won the title from 4th place. One of the great underdog stories in cricket history. DD topped the IPL points table but went home empty-handed.
IPL 2008 Points Table
Champion: Rajasthan Royals | Playoff teams: RR, KXIP, CSK, DD
| Pos | Team | M | W | L | N/R | Pts | NRR |
|---|---|---|---|---|---|---|---|
| 1 | Rajasthan Royals ✅ | 14 | 11 | 3 | 0 | 22 | +0.632 |
| 2 | Punjab Kings ✅ | 14 | 10 | 4 | 0 | 20 | +0.509 |
| 3 | Chennai Super Kings ✅ | 14 | 8 | 6 | 0 | 16 | -0.192 |
| 4 | Delhi Daredevils ✅ | 14 | 7 | 6 | 1 | 15 | +0.342 |
| 5 | Mumbai Indians | 14 | 7 | 7 | 0 | 14 | +0.570 |
| 6 | Kolkata Knight Riders | 14 | 6 | 7 | 1 | 13 | -0.147 |
| 7 | Royal Challengers Bengaluru | 14 | 4 | 10 | 0 | 8 | -1.160 |
| 8 | Deccan Chargers | 14 | 2 | 12 | 0 | 4 | -0.467 |
The inaugural IPL season. Rajasthan Royals, captained by Shane Warne, topped the IPL points table with 22 points — one of the highest totals ever — and won the title. A franchise no one expected anything from. Deccan Chargers finished with just 4 points, the joint-lowest in IPL history.
All-Time IPL Points Table (2008–2026)
Most matches won in IPL history
| Team | Matches | Wins | Win % |
|---|---|---|---|
| Mumbai Indians | 277 | 151 | 54.51% |
| Chennai Super Kings | 253 | 142 | 56.12% |
| Kolkata Knight Riders | 265 | 135 | 50.94% |
| Royal Challengers Bengaluru | 271 | 132 | 48.70% |
| Rajasthan Royals | 236 | 114 | 48.30% |
| Sunrisers Hyderabad | 196 | 93 | 47.44% |
| Delhi Capitals | 266 | 118 | 44.36% |
| Punjab Kings | 263 | 119 | 45.24% |
Highest win percentage (min. 40 matches)
| Team | Win % |
|---|---|
| Gujarat Titans | 61.66% |
| Chennai Super Kings | 56.12% |
| Mumbai Indians | 54.51% |
| Lucknow Super Giants | 51.72% |
| Kolkata Knight Riders | 50.94% |
Most points earned by a franchise (all-time, league stage)
CSK and MI lead comfortably, each with over 280 all-time league points across their seasons. KKR sit third. RCB have played nearly as many matches as MI but earned fewer points due to inconsistent campaigns until recently.
Best performing IPL teams of all time
Mumbai Indians hold the record for most wins (151) and most titles (5, tied with CSK). They topped the IPL points table 4 times and won back-to-back titles twice — in 2019-2020 and 2014-2015 (with a gap).
Chennai Super Kings have qualified for the playoffs 12 times in 17 eligible seasons. That’s a consistency record no one else comes close to matching. 5 titles, same as MI.
Kolkata Knight Riders have 3 titles and consistently made the playoffs, though their form dipped between 2016 and 2021.
Royal Challengers Bengaluru spent 17 years as the most famous team to never win a title — and then won back-to-back in 2025 and 2026. Their all-time win percentage is 48.70%, respectable for a team that reached 3 finals before finally winning.
Teams with most IPL playoff appearances
| Team | Playoff Appearances (out of eligible seasons) |
|---|---|
| Chennai Super Kings | 12 of 17 |
| Mumbai Indians | 11 of 19 |
| Kolkata Knight Riders | 11 of 19 |
| Royal Challengers Bengaluru | 9 of 19 |
| Rajasthan Royals | 8 of 17 |
| Delhi Capitals | 7 of 19 |
| Sunrisers Hyderabad | 7 of 13 |
| Punjab Kings | 3 of 19 |
Punjab Kings’ 3 playoff appearances from 19 seasons is the worst rate for any original franchise. For all the talent they’ve acquired over the years, they’ve only made it out of the league stage 3 times.
Teams that topped the IPL points table but didn’t win the trophy
This is where it gets brutal.
Delhi Daredevils (2009, 2012) topped the table twice and won nothing. Both years they crashed out in the playoffs. The 2012 campaign — 22 points from 16 matches — remains the highest-ever points tally by a non-champion.
Gujarat Lions (2016) topped the table in their debut season but fell to SRH in the playoffs. They only played 2 seasons before being dissolved.
Punjab Kings (2014) hit 22 points — matching the all-time record — and lost the final to KKR. They’re still waiting for their first title.
Punjab Kings (2025) topped the IPL points table again, this time losing the final to RCB by just 6 runs. Same heartbreak, 11 years apart.
Delhi Capitals (2021) posted their best-ever IPL points table finish (20 points) and again lost in the playoffs. DC haven’t won a title since 2003-04, in the old Ranji-style format.
IPL champions vs points table leaders (season-wise)
| Season | Table Topper | IPL Winner | Same? |
|---|---|---|---|
| 2008 | Rajasthan Royals | Rajasthan Royals | ✅ Yes |
| 2009 | Delhi Daredevils | Deccan Chargers | ❌ No |
| 2010 | Mumbai Indians | Chennai Super Kings | ❌ No |
| 2011 | Royal Challengers Bengaluru | Chennai Super Kings | ❌ No |
| 2012 | Delhi Daredevils | Kolkata Knight Riders | ❌ No |
| 2013 | Chennai Super Kings | Mumbai Indians | ❌ No |
| 2014 | Punjab Kings | Kolkata Knight Riders | ❌ No |
| 2015 | Chennai Super Kings | Mumbai Indians | ❌ No |
| 2016 | Gujarat Lions | Sunrisers Hyderabad | ❌ No |
| 2017 | Mumbai Indians | Mumbai Indians | ✅ Yes |
| 2018 | Sunrisers Hyderabad | Chennai Super Kings | ❌ No |
| 2019 | Mumbai Indians | Mumbai Indians | ✅ Yes |
| 2020 | Mumbai Indians | Mumbai Indians | ✅ Yes |
| 2021 | Delhi Capitals | Chennai Super Kings | ❌ No |
| 2022 | Gujarat Titans | Gujarat Titans | ✅ Yes |
| 2023 | Gujarat Titans | Chennai Super Kings | ❌ No |
| 2024 | Kolkata Knight Riders | Kolkata Knight Riders | ✅ Yes |
| 2025 | Punjab Kings | Royal Challengers Bengaluru | ❌ No |
| 2026 | Royal Challengers Bengaluru | Royal Challengers Bengaluru | ✅ Yes |
The table topper has won the title only 7 times in 19 seasons. 12 seasons, the champion came from 2nd, 3rd, or 4th position. The IPL playoffs format deliberately gives multiple teams a shot.
Interesting IPL points table records
Highest points in a season (14-match format)
22 points — Rajasthan Royals (2008), Punjab Kings (2014). Only 2 teams have achieved this in the standard 14-match format. Both did it with 11 wins. Remarkably, only RR won the title.
In the 16-match format (2012–2013), Delhi Daredevils and Chennai Super Kings/Mumbai Indians also reached 22 points.
Lowest points in a season
4 points — Deccan Chargers (2008) and Delhi Daredevils (2014). Both finished with just 2 wins. What makes DC’s case extraordinary: they came back the very next year and won the title.
Best net run rate ever recorded
+1.428 — Kolkata Knight Riders in 2024. The best NRR in IPL history by a team that actually won the title. They backed it up with a championship win.
Most consecutive playoff qualifications
Chennai Super Kings have the all-time record — 12 playoff appearances in 17 eligible seasons. Their only missed qualifications came in 2020 (COVID season, UAE) and during their suspension years. That kind of sustained performance across nearly 2 decades is unmatched.
Most consecutive last-place finishes
No team has finished last 3 times running, but Deccan Chargers — who were dissolved in 2012 — finished in the bottom half in 5 of their 6 seasons after their 2009 title. One of the steepest declines in IPL franchise history.
IPL points table trends and insights
Most consistent teams
CSK and MI, by a distance. CSK have qualified 12 times. MI have 151 total wins, more than anyone. Both franchises have been so consistent that years where they finish bottom — CSK and MI both did in 2022 — feel genuinely shocking.
Gujarat Titans (2022–2026) posted the highest win percentage in IPL history (61.66%) across their 5 seasons, though that’s across fewer matches than the established franchises.
Biggest rise and fall in IPL history
Biggest rise: Deccan Chargers, 4 points in 2008 → IPL champions in 2009. No one has ever bounced back harder.
Biggest fall: SRH, 2016 champions → 6 points and 3 wins in 2021. From title winners to wooden-spoon finishers in 5 years.
Biggest sudden collapse: MI and CSK both falling to last place simultaneously in 2022, a season where Gujarat Titans — playing their first-ever game — topped the IPL points table and won everything.
Best new franchise performance
Gujarat Titans (2022) hold this record easily. They debuted in 2022, topped the IPL points table with 20 points, and won the title. No expansion team in any major T20 league has had a better debut season.
Lucknow Super Giants (2022) also debuted that year and immediately qualified for the playoffs with 18 points. Strong start, consistent since.
Impact of the 10-team IPL format
From 2022 onward, the IPL expanded to 10 teams and 74 matches per season (later standardised at 70). The longer season has made the IPL points table race more competitive. In 2022, just 12 points separated 1st and 10th place. Teams can no longer afford to write off early-season losses, because the bottom of the table is more competitive.
The 10-team format has also made NRR more important. In 2026, 3 teams finished level on 18 points — NRR decided their positions and playoff fate.
Frequently Asked Questions (FAQs)
How is the IPL points table calculated?
Each team plays 14 league matches. A win earns 2 points. A no-result earns 1 point. A loss earns 0. Teams are ranked by total points, with NRR as the tiebreaker.
What happens if two teams have the same points?
NRR decides. If NRR is also identical (very rare), head-to-head result in the league stage is used. In practice, NRR almost always settles it.
How many teams qualify for IPL playoffs?
4 teams. The top 2 on the IPL points table play Qualifier 1. The next 2 play the Eliminator. The top 2 get 2 chances to reach the final; the bottom 2 get only 1.
Which team has topped the IPL points table most times?
Mumbai Indians, with 4 table-toppers (2010, 2017, 2019, 2020). Chennai Super Kings and Delhi Capitals/Daredevils follow with 2 each.
Which team has the highest win percentage in IPL history?
Gujarat Titans, at 61.66% — but across only 5 seasons. Among franchises with 10+ seasons, Chennai Super Kings lead at 56.12%, followed by Mumbai Indians at 54.51%.
Can a team qualify with 14 points?
Possibly, but it depends on what everyone else does. 14 points means 7 wins from 14 matches. In most seasons, the 4th-place qualifier has had 14–16 points. In some seasons (like 2024), 4 teams tied on 14 points and NRR separated those who qualified from those who didn’t.
What is a good NRR in IPL?
Anything above +0.500 is considered strong. Above +1.000 is exceptional. In 2024, KKR’s +1.428 was historically dominant. A positive NRR generally means you’re winning comfortably when you win and losing narrowly when you lose — the ideal combination. Teams frequently monitor their NRR during tight IPL points table races, sometimes choosing to bat aggressively after a win is secured, simply to boost that number.